Financial Highlights
- Top page
- Company Information
- Financial Information
- Financial Highlights
Here we present our financial highlights.
There are graphs of sales, ordinary income, and other indicators of performance over time.
-
Sales
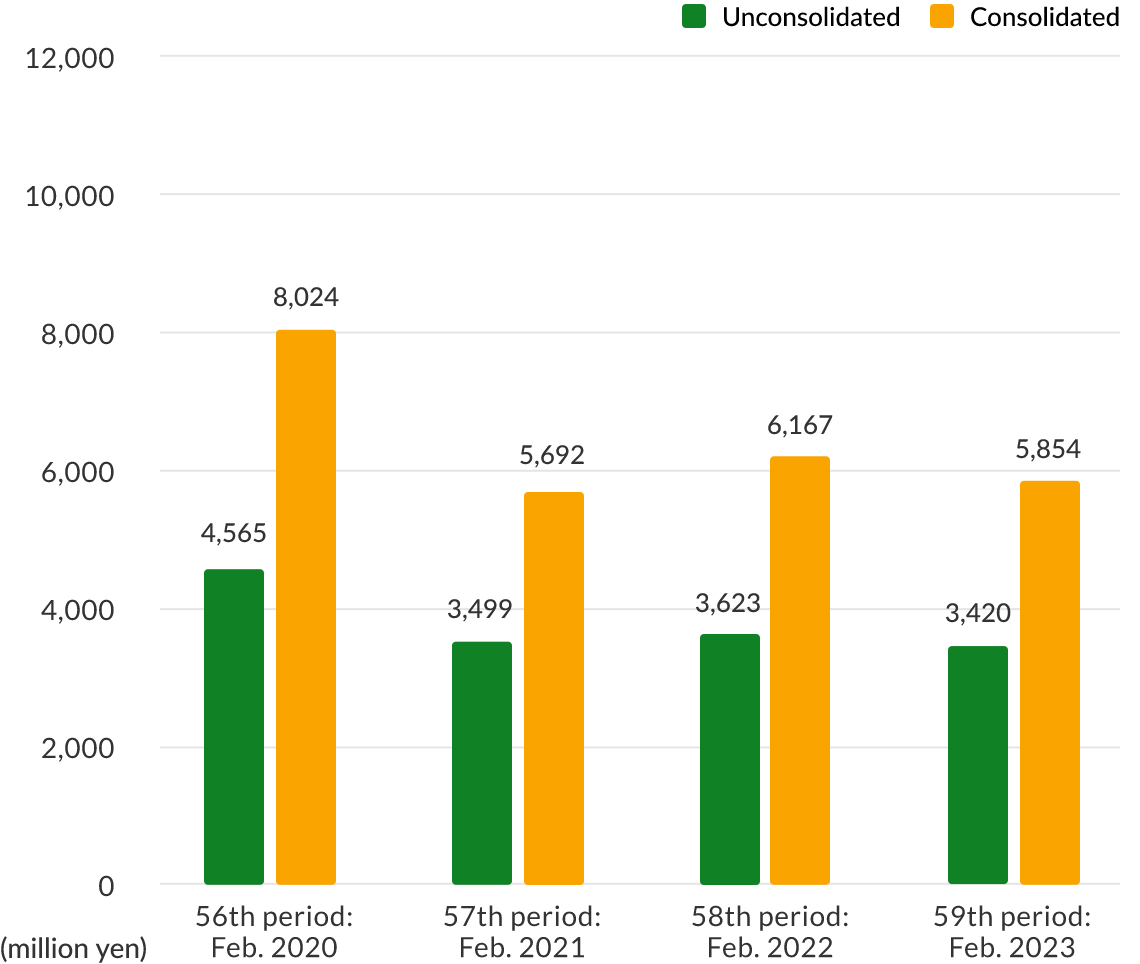
56th period
Feb. 202057th period
Feb. 202158th period
Feb. 202259th period
Feb. 2023Unconsolidated 4,565 3,499 3,623 3,420 Consolidated 8,024 5,692 6,167 5,854 -
Ordinary Income
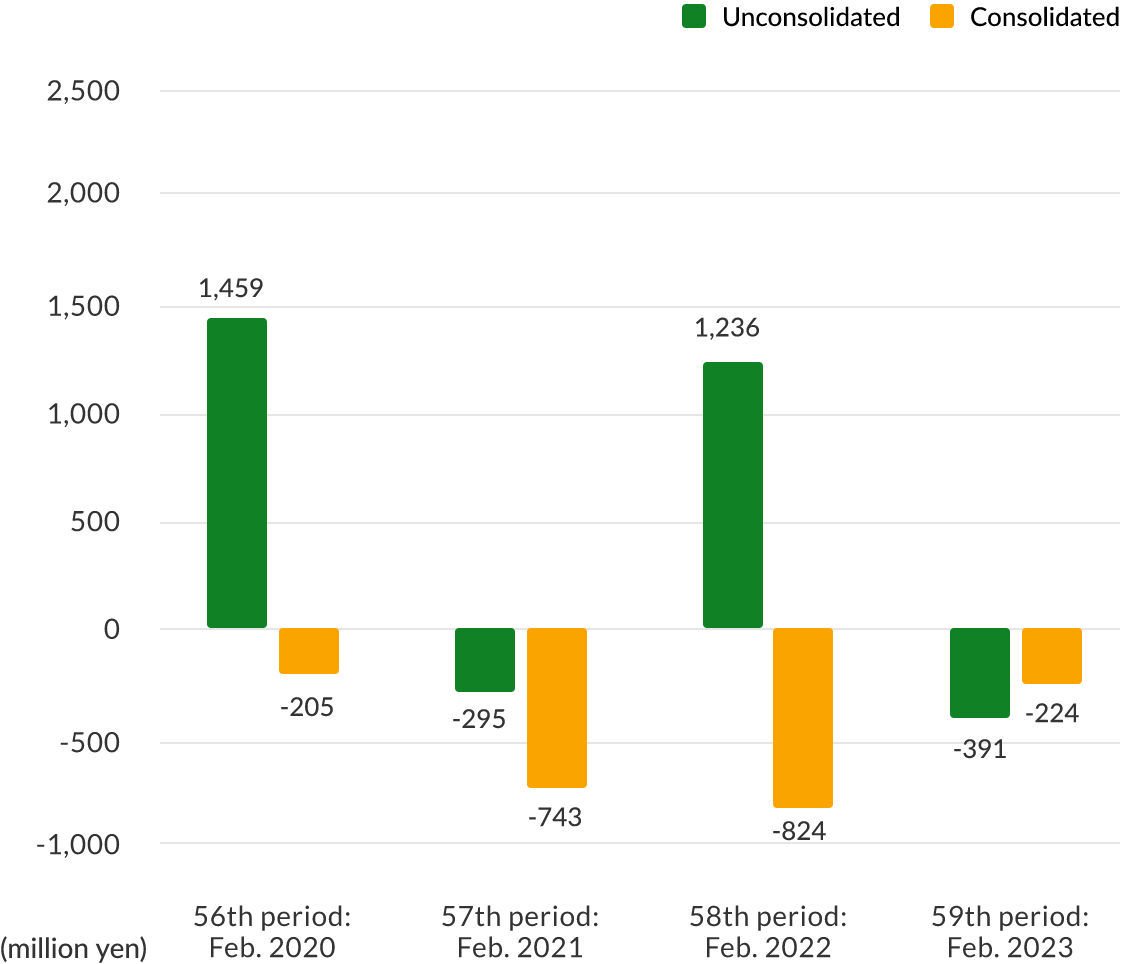
56th period
Feb. 202057th period
Feb. 202158th period
Feb. 202259th period
Feb. 2023Unconsolidated 1,459 -295 1,236 -391 Consolidated -205 -743 -824 -224 -
Current Net Income
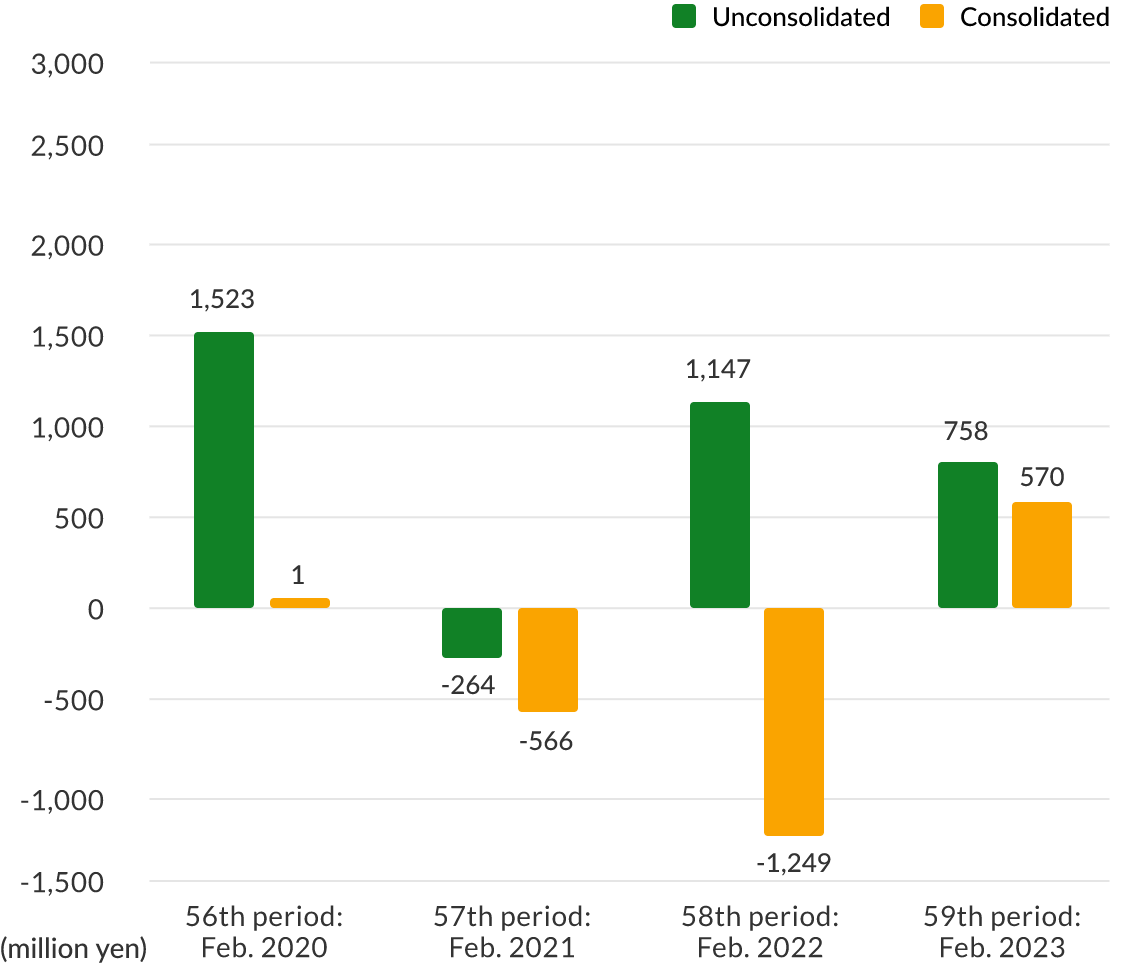
56th period
Feb. 202057th period
Feb. 202158th period
Feb. 202259th period
Feb. 2023Unconsolidated 1,523 -264 1,147 758 Consolidated 1 -566 -1,249 570 -
Total Assets
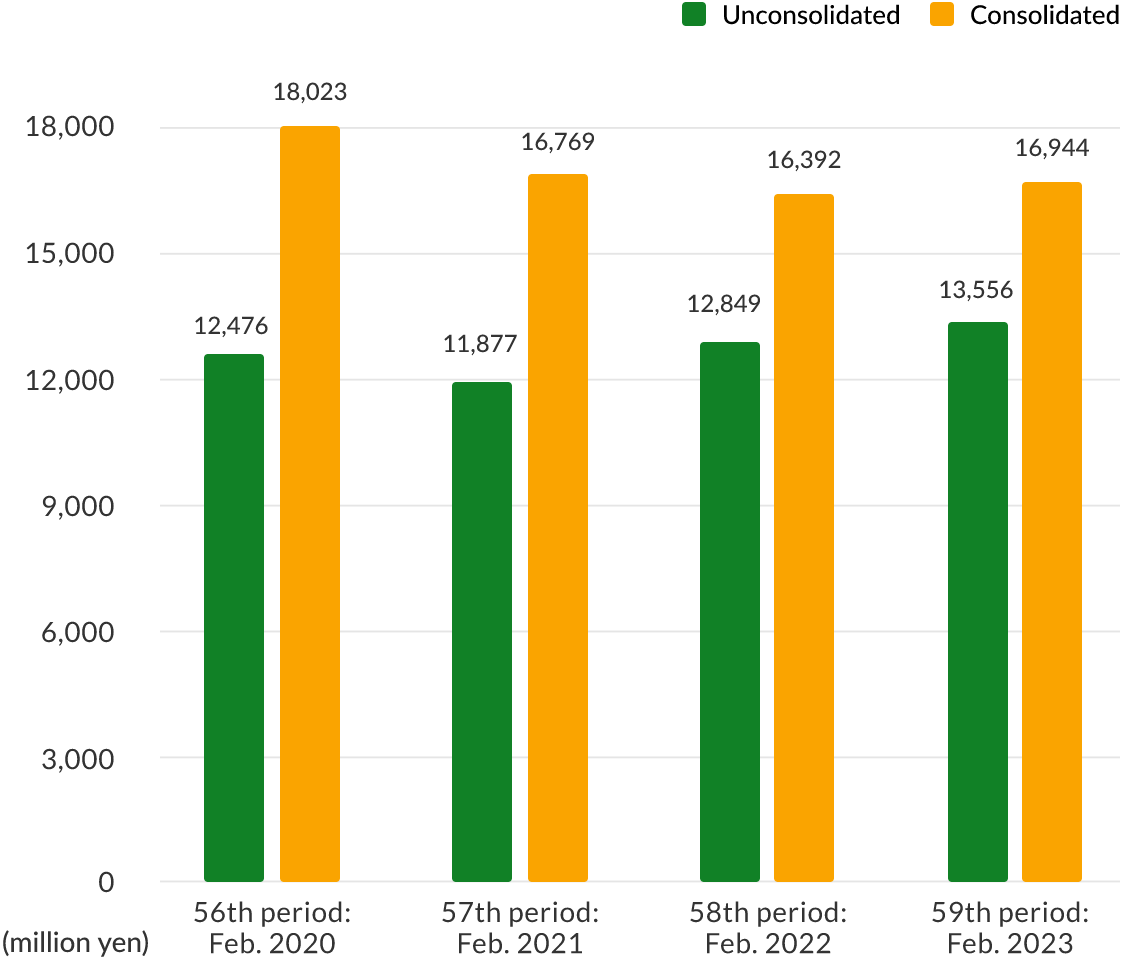
56th period
Feb. 202057th period
Feb. 202158th period
Feb. 202259th period
Feb. 2023Unconsolidated 12,476 11,877 12,849 13,556 Consolidated 18,023 16,769 16,392 16,944 -
Capital-To-Asset Ratio
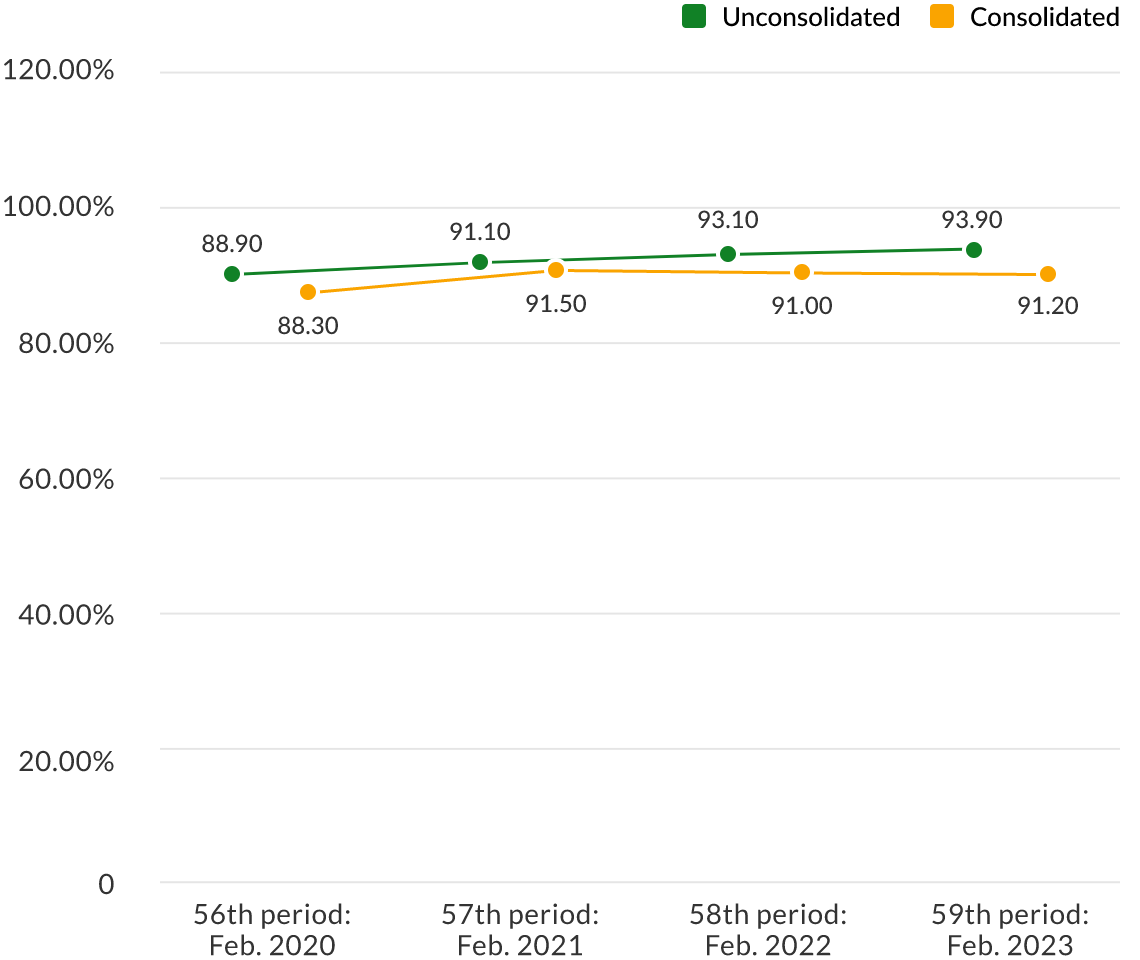
56th period
Feb. 202057th period
Feb. 202158th period
Feb. 202259th period
Feb. 2023Unconsolidated 88.90 91.10 93.10 93.90 Consolidated 88.30 91.50 91.00 91.20 -
Net Assets Per Share
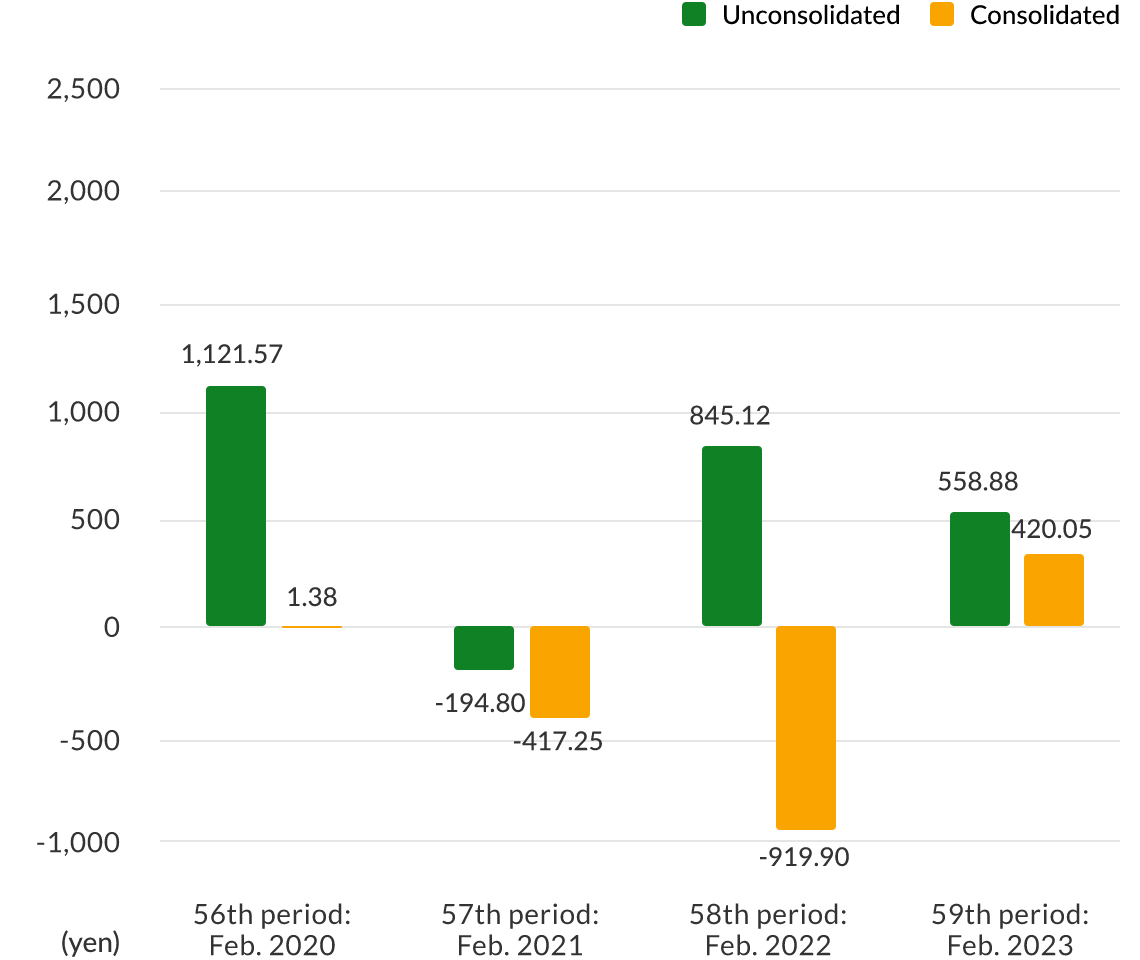
56th period
Feb. 202057th period
Feb. 202158th period
Feb. 202259th period
Feb. 2023Unconsolidated 1,121.57 -194.80 845.12 558.88 Consolidated 1.38 -417.25 -919.90 420.05 -
Current Net Income Per Share
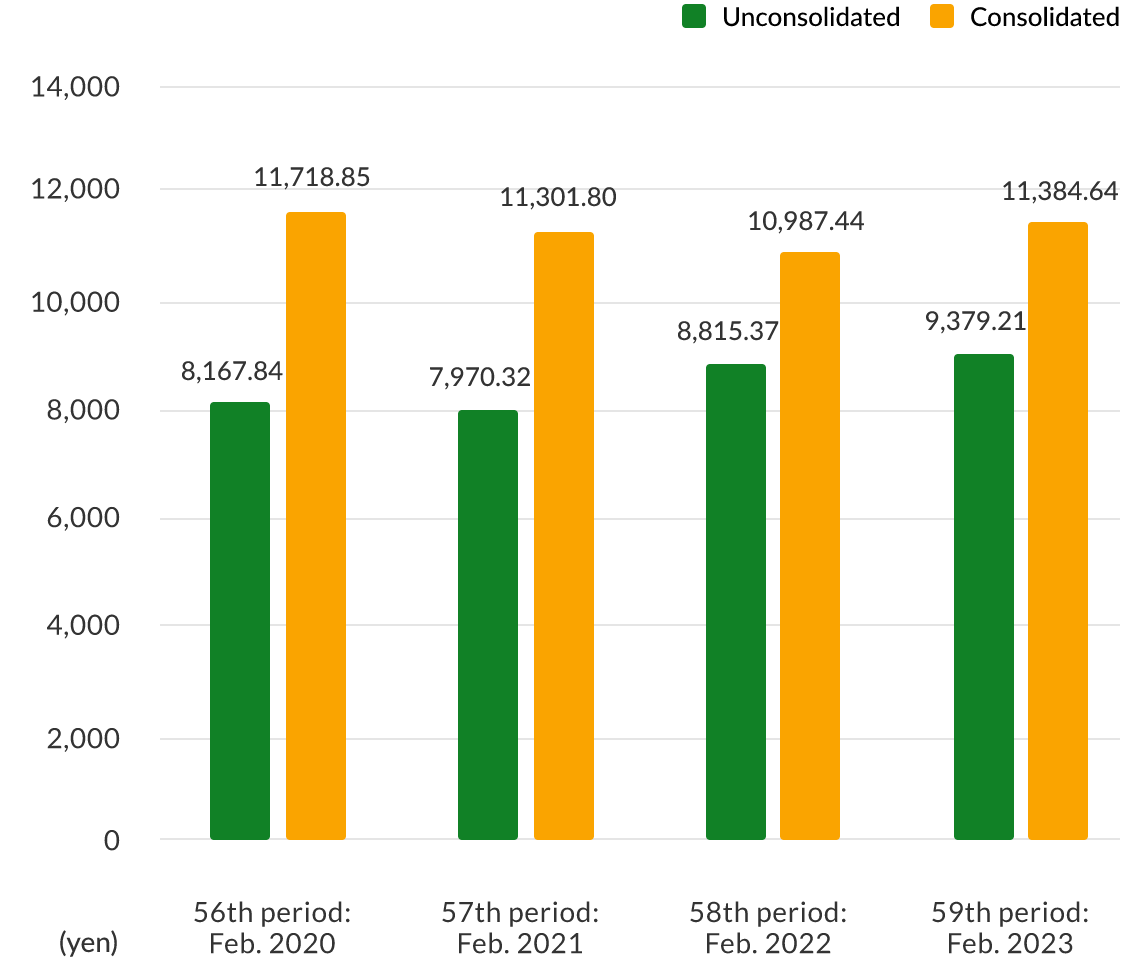
56th period
Feb. 202057th period
Feb. 202158th period
Feb. 202259th period
Feb. 2023Unconsolidated 8,167.84 7,970.32 8,815.37 9,379.21 Consolidated 11,718.85 11,301.80 10,987.44 11,384.64