Financial Highlights
- Top page
- Company Information
- Financial Information
- Financial Highlights
Here we present our financial highlights.
There are graphs of sales, ordinary income, and other indicators of performance over time.
-
Sales
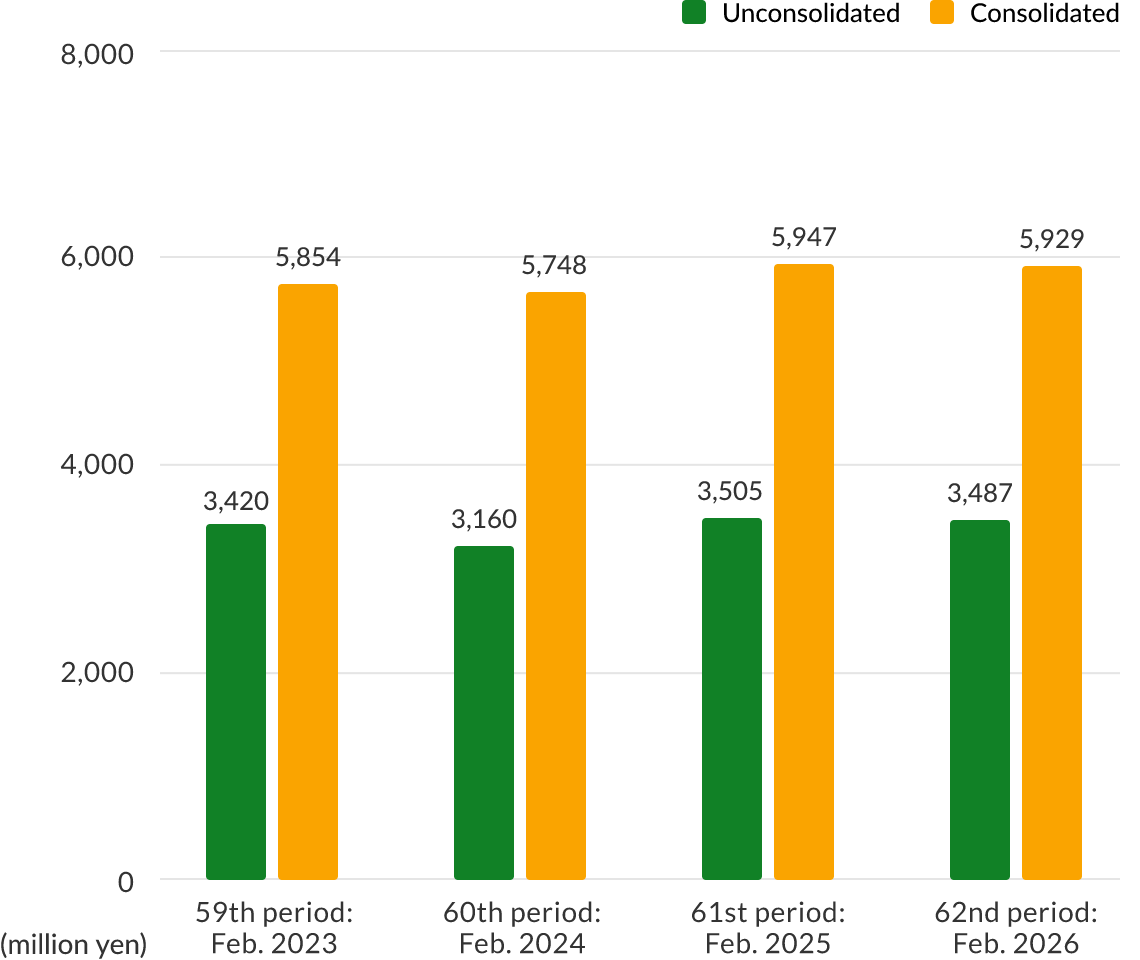
59th period
Feb. 202360th period
Feb. 202461st period
Feb. 202562nd period
Feb. 2026Unconsolidated 3,420 3,160 3,505 3,487 Consolidated 5,854 5,748 5,947 5,929 -
Ordinary Income
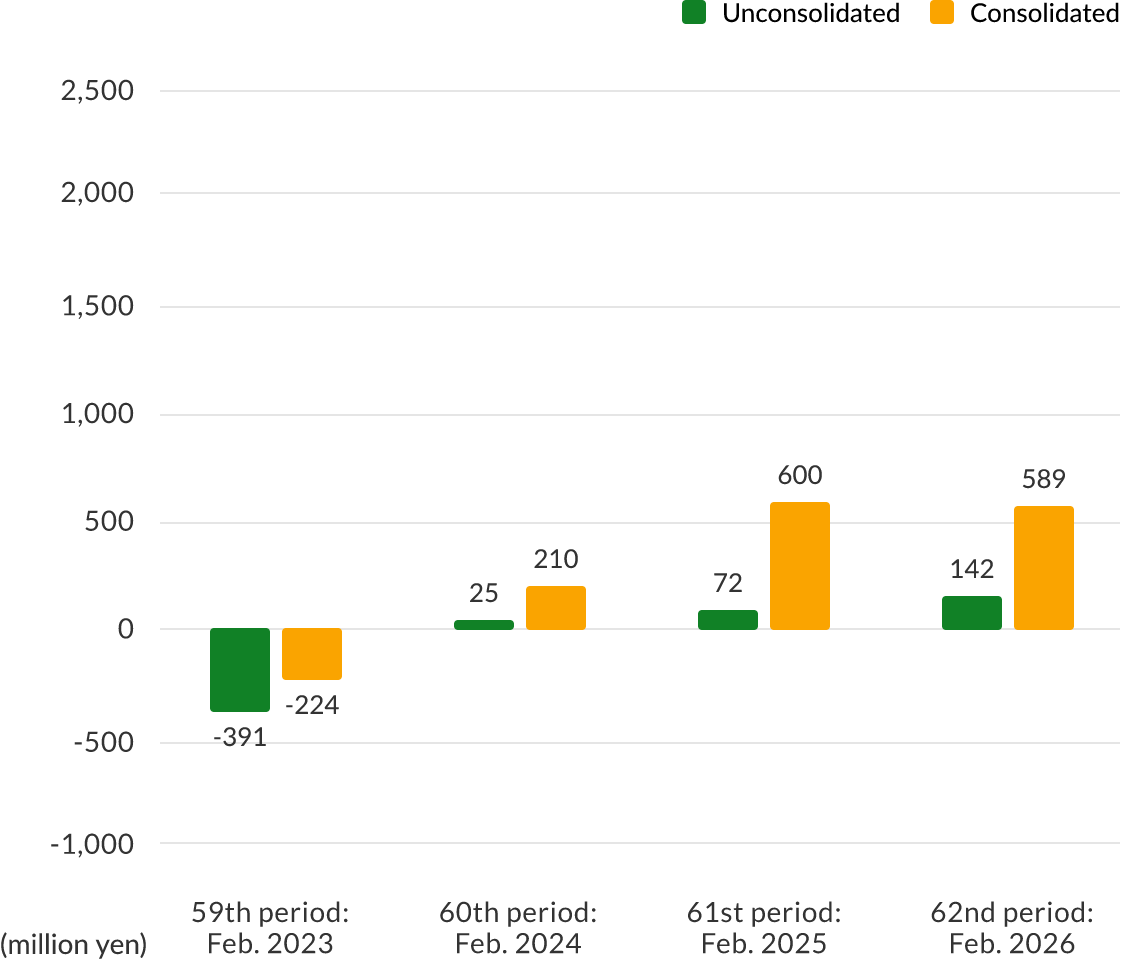
59th period
Feb. 202360th period
Feb. 202461st period
Feb. 202562nd period
Feb. 2026Unconsolidated -391 25 72 142 Consolidated -224 210 600 589 -
Current Net Income
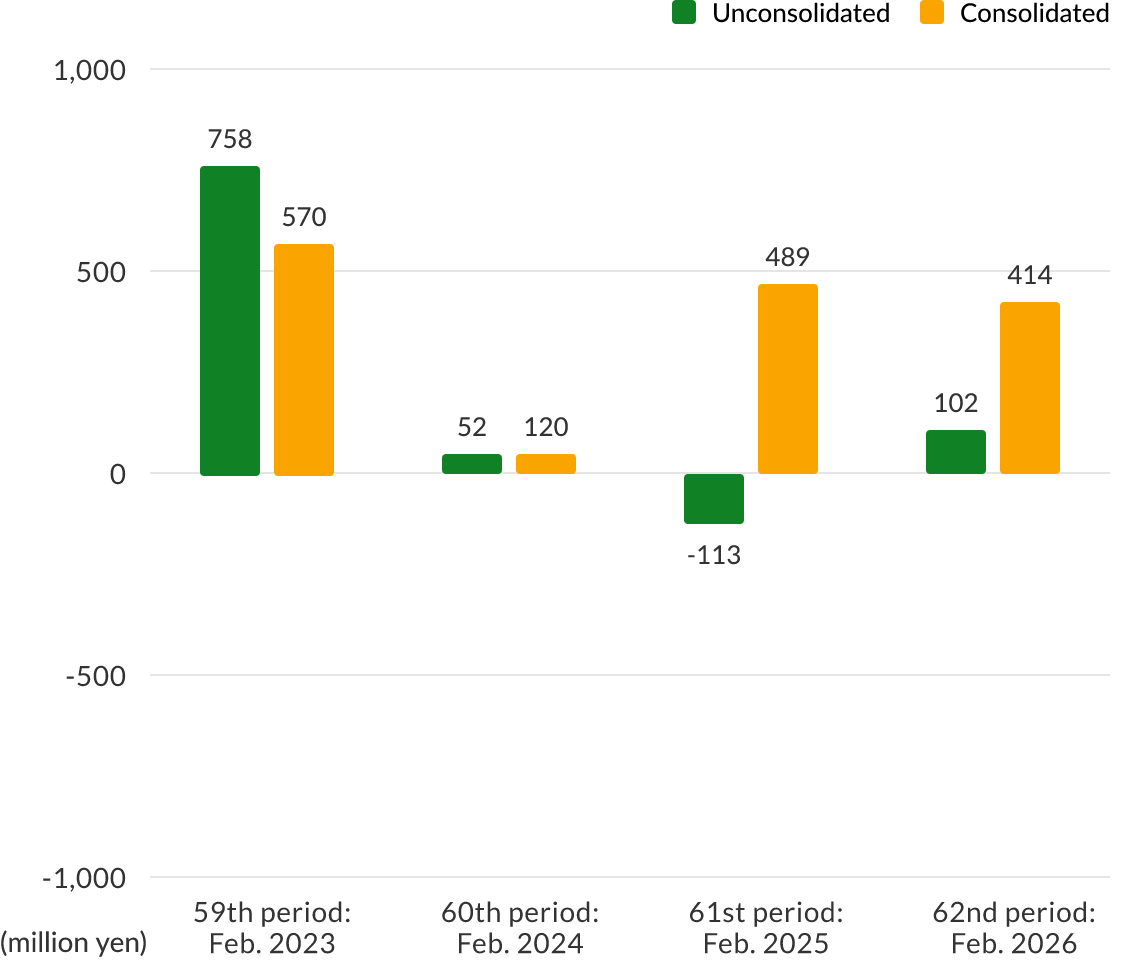
59th period
Feb. 202360th period
Feb. 202461st period
Feb. 202562nd period
Feb. 2026Unconsolidated 758 52 -113 102 Consolidated 570 120 489 414 -
Total Assets
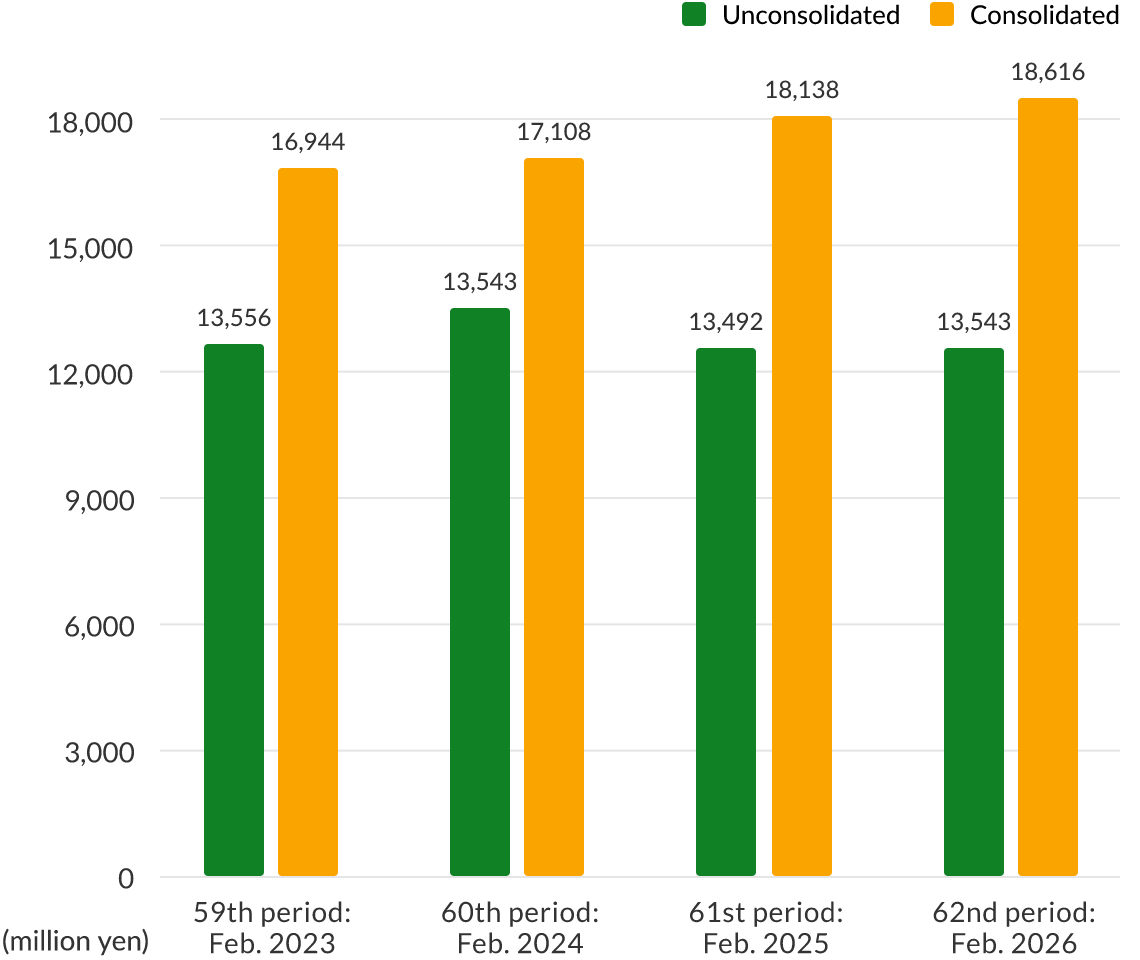
59th period
Feb. 202360th period
Feb. 202461st period
Feb. 202562nd period
Feb. 2026Unconsolidated 13,556 13,543 13,492 13,543 Consolidated 16,944 17,108 18,138 18,616 -
Capital-To-Asset Ratio
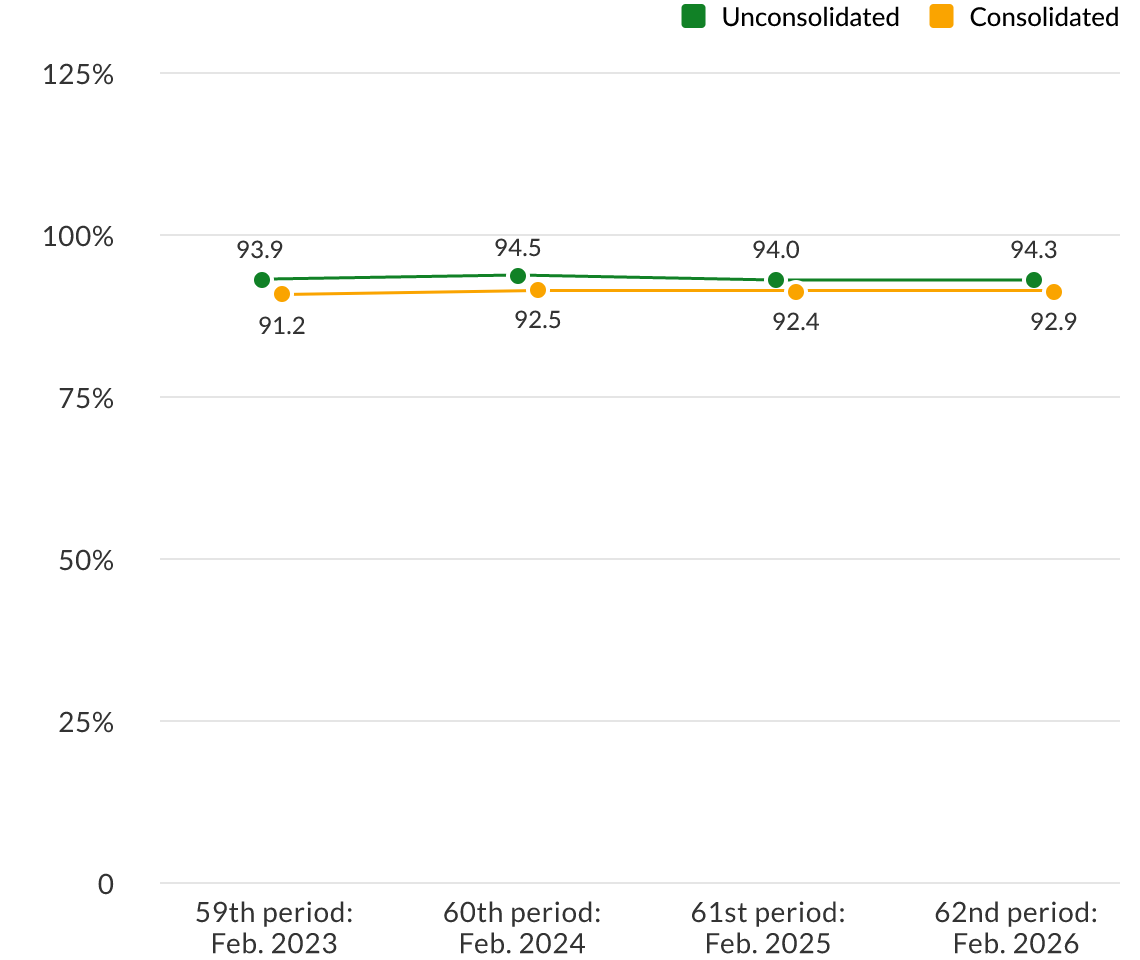
59th period
Feb. 202360th period
Feb. 202461st period
Feb. 202562nd period
Feb. 2026Unconsolidated 93.9 94.5 94.0 94.3 Consolidated 91.2 92.5 92.4 92.9 -
Net Assets Per Share
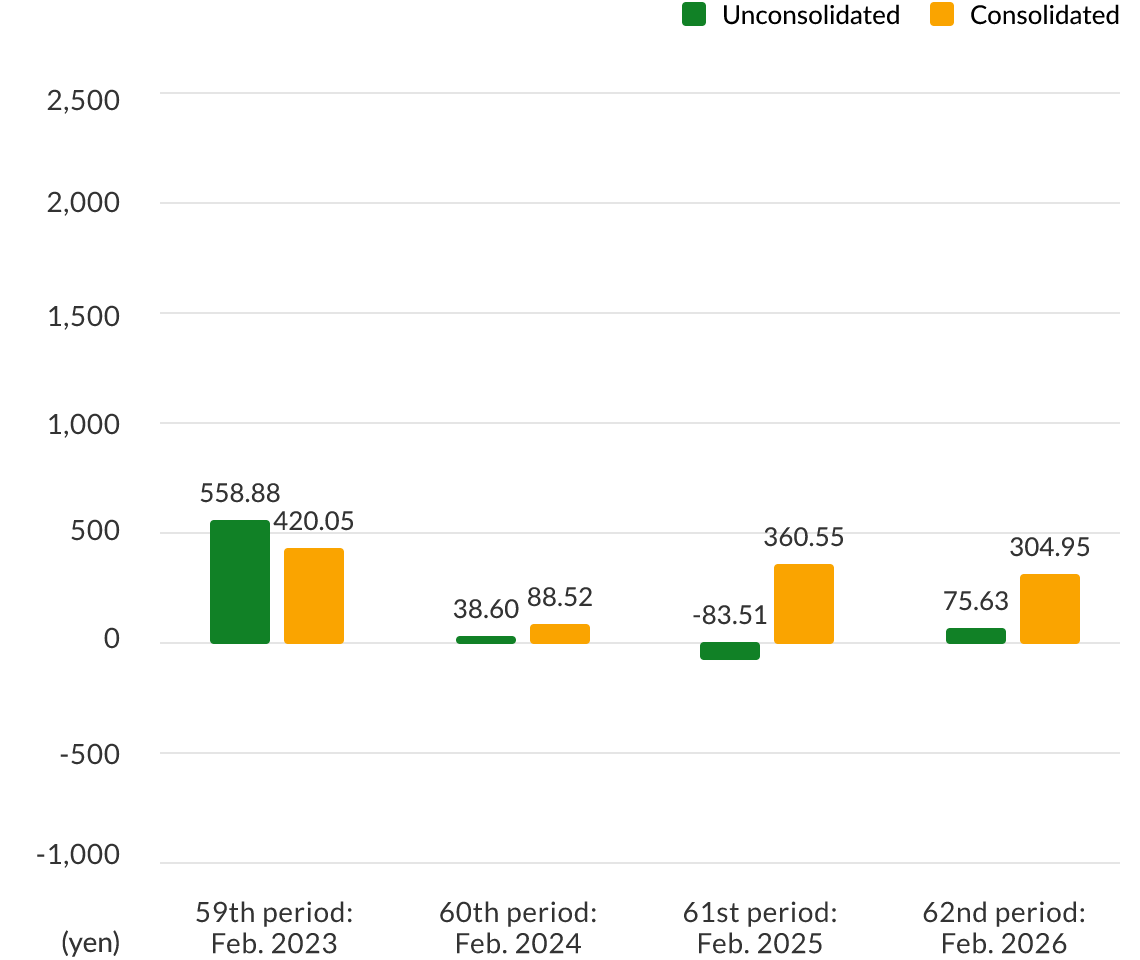
59th period
Feb. 202360th period
Feb. 202461st period
Feb. 202562nd period
Feb. 2026Unconsolidated 558.88 38.60 -83.51 75.63 Consolidated 420.05 88.52 360.55 304.95 -
Current Net Income Per Share
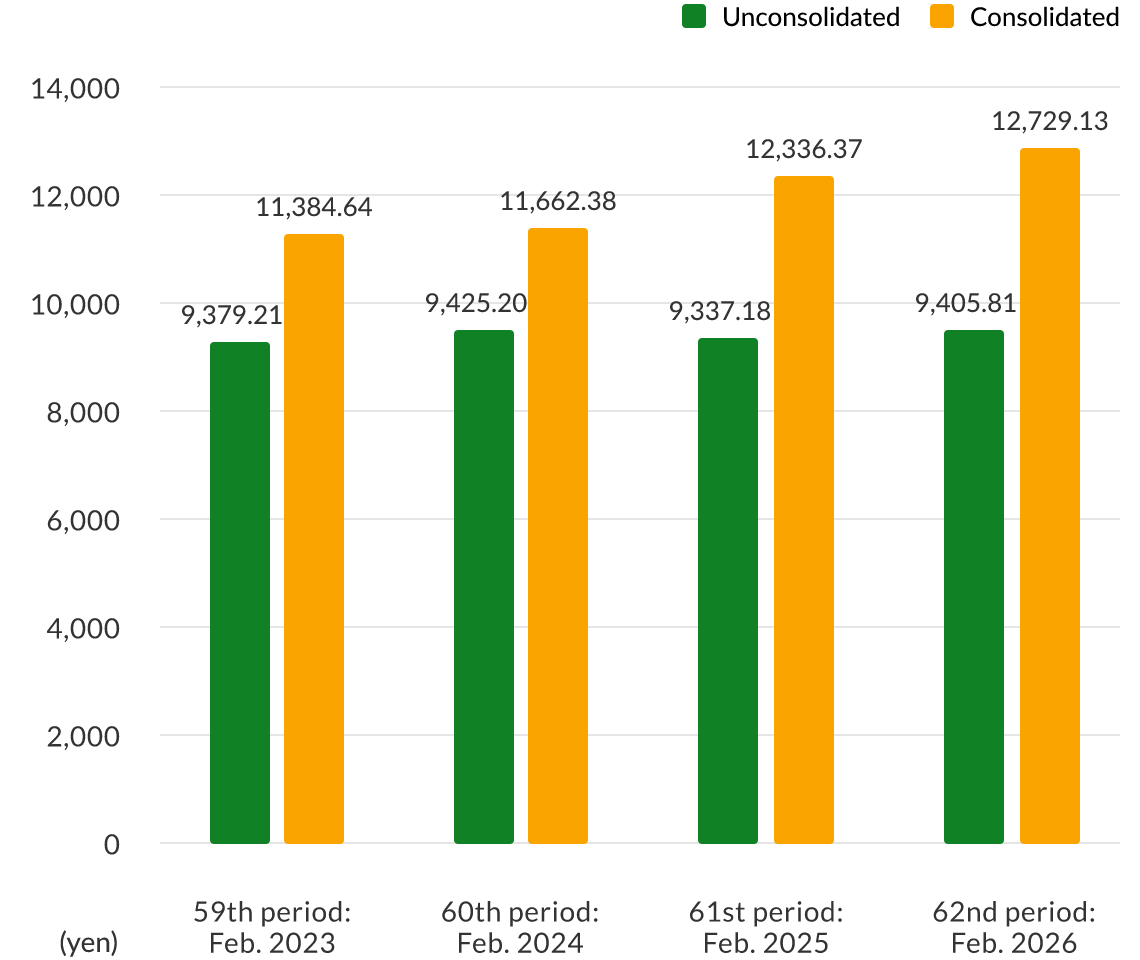
59th period
Feb. 202360th period
Feb. 202461st period
Feb. 202562nd period
Feb. 2026Unconsolidated 9,379.21 9,425.20 9,337.18 9,405.81 Consolidated 11,384.64 11,662.38 12,336.37 12,729.13