Financial Highlights
- Top page
- Company Information
- Financial Information
- Financial Highlights
Here we present our financial highlights.
There are graphs of sales, ordinary income, and other indicators of performance over time.
-
Sales

58th period
Feb. 202259th period
Feb. 202360th period
Feb. 202461st period
Feb. 2025Unconsolidated 3,623 3,420 3,160 3,505 Consolidated 6,167 5,854 5,748 5,947 -
Ordinary Income
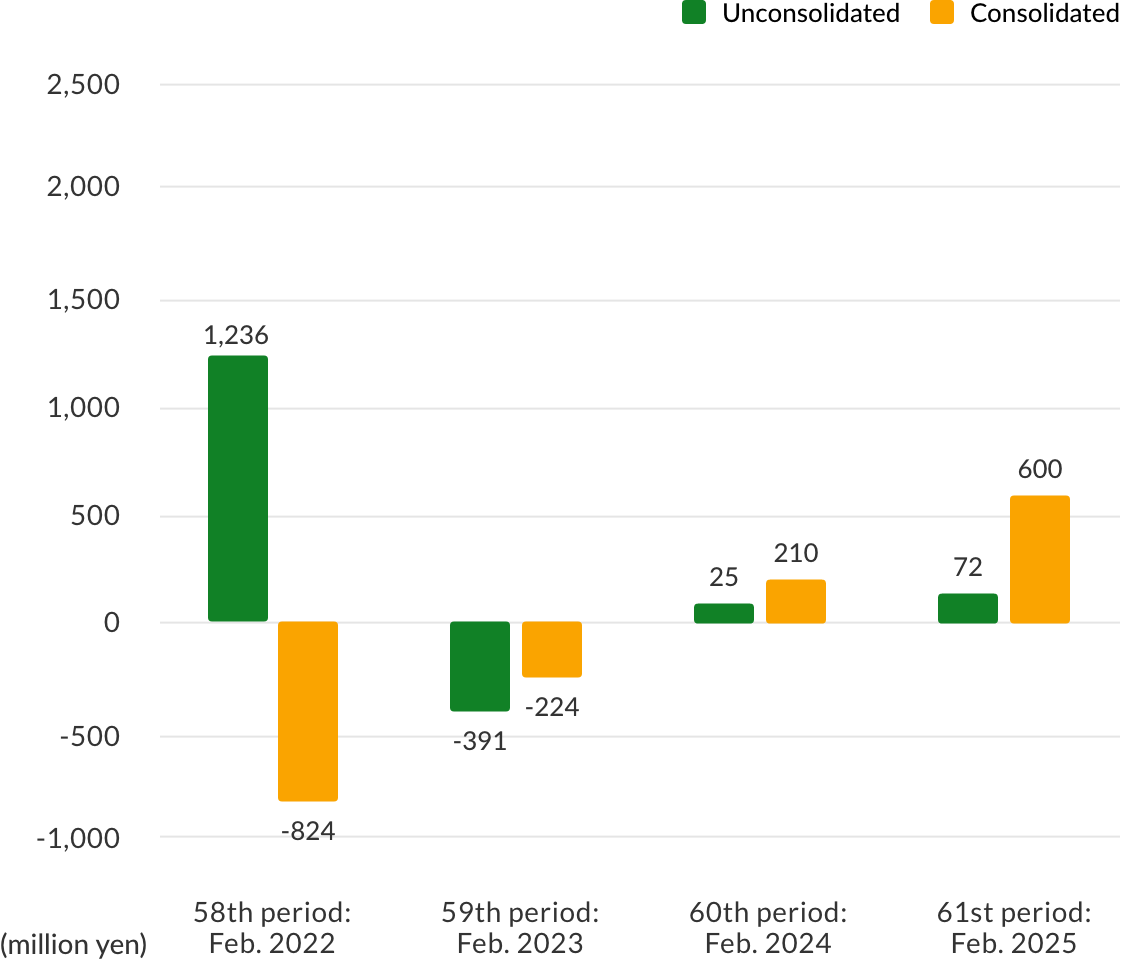
58th period
Feb. 202259th period
Feb. 202360th period
Feb. 202461st period
Feb. 2025Unconsolidated 1,236 -391 25 72 Consolidated -824 -224 210 600 -
Current Net Income
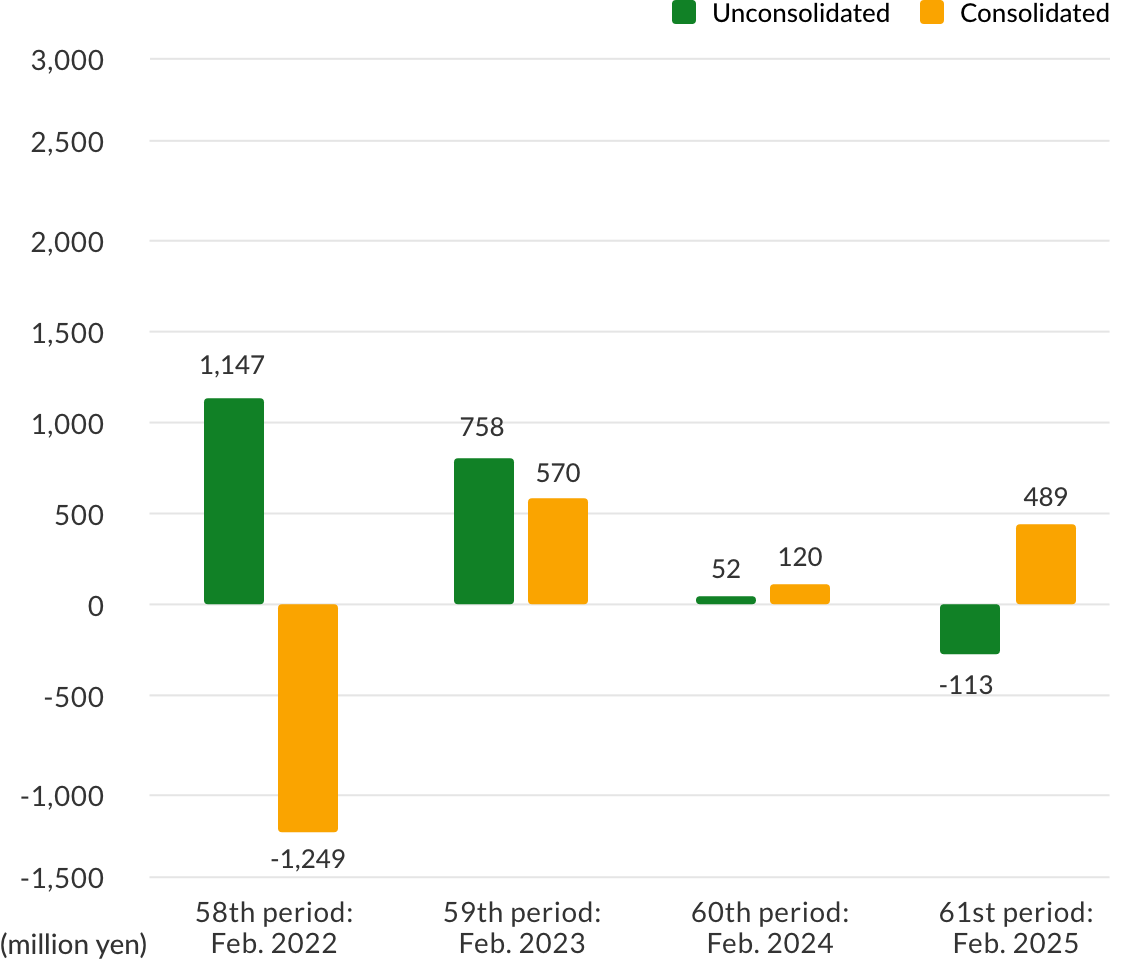
58th period
Feb. 202259th period
Feb. 202360th period
Feb. 202461st period
Feb. 2025Unconsolidated 1,147 758 52 -113 Consolidated -1,249 570 120 489 -
Total Assets
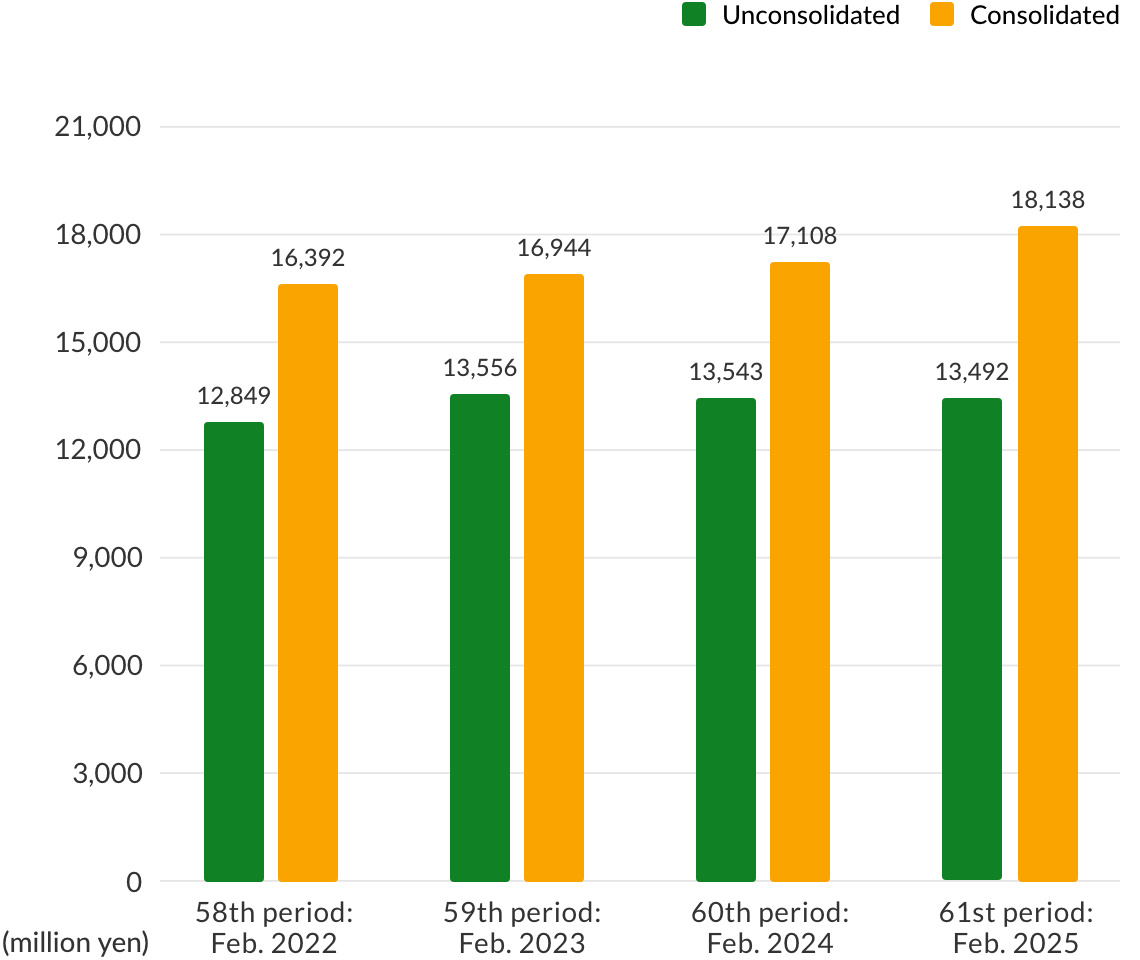
58th period
Feb. 202259th period
Feb. 202360th period
Feb. 202461st period
Feb. 2025Unconsolidated 12,849 13,556 13,543 13,492 Consolidated 16,392 16,944 17,108 18,138 -
Capital-To-Asset Ratio
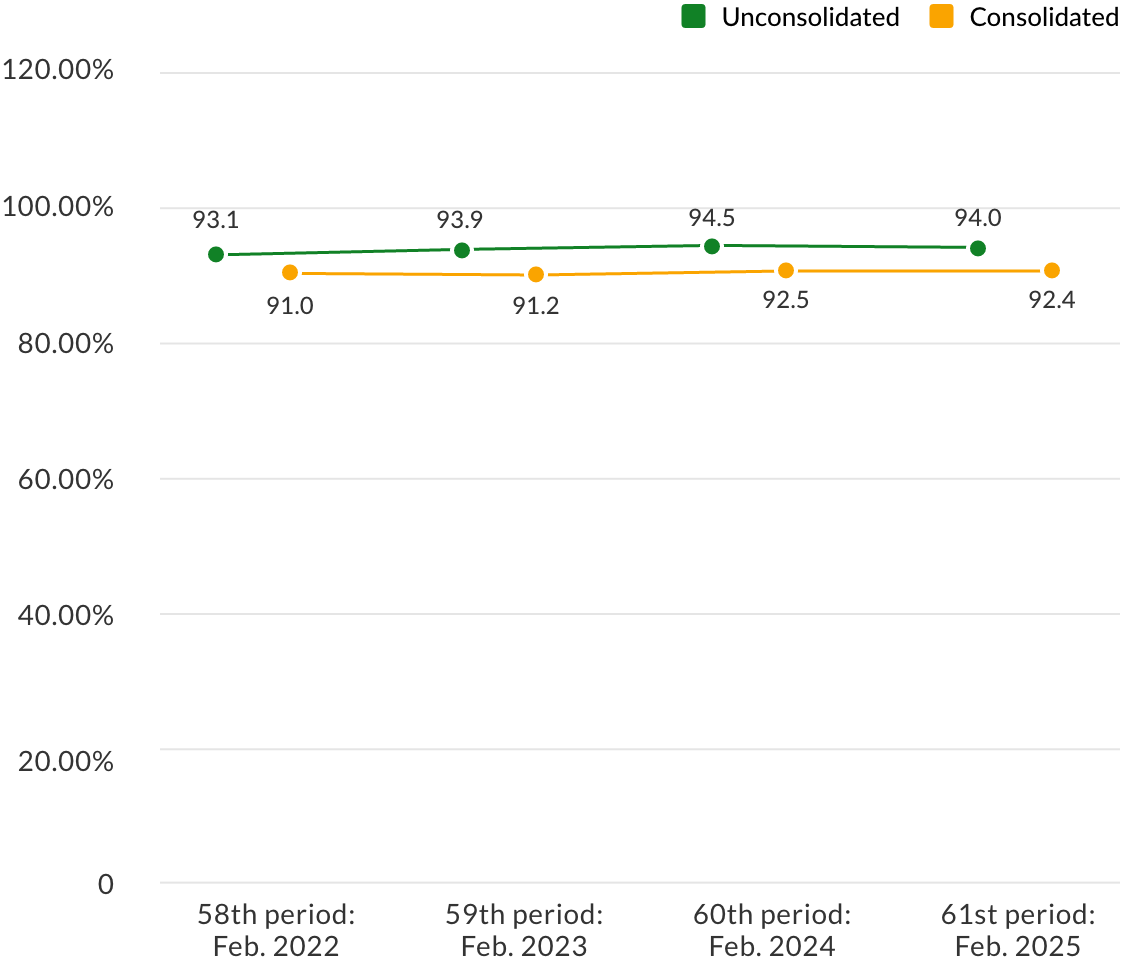
58th period
Feb. 202259th period
Feb. 202360th period
Feb. 202461st period
Feb. 2025Unconsolidated 93.1 93.9 94.5 94.0 Consolidated 91.0 91.2 92.5 92.4 -
Net Assets Per Share
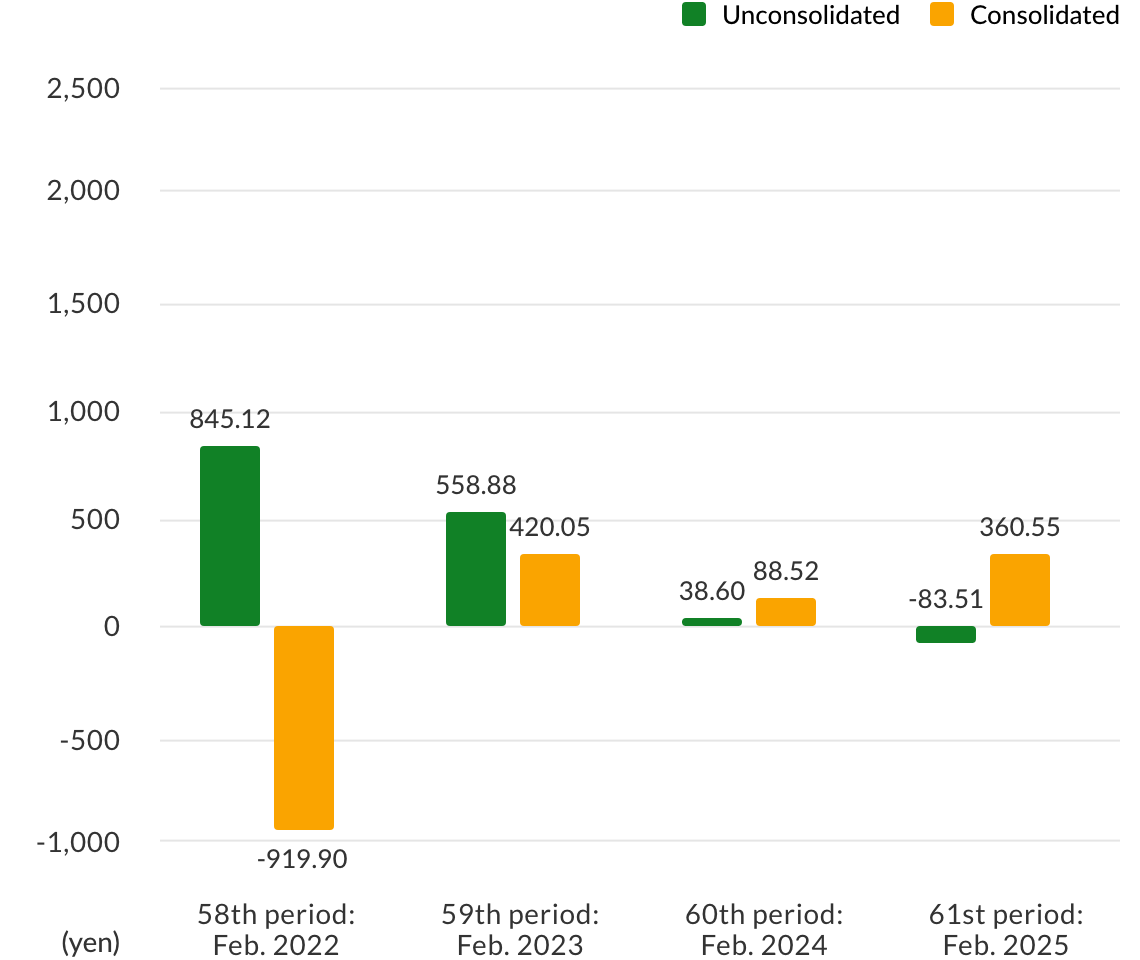
58th period
Feb. 202259th period
Feb. 202360th period
Feb. 202461st period
Feb. 2025Unconsolidated 845.12 558.88 38.60 -83.51 Consolidated -919.90 420.05 88.52 360.55 -
Current Net Income Per Share
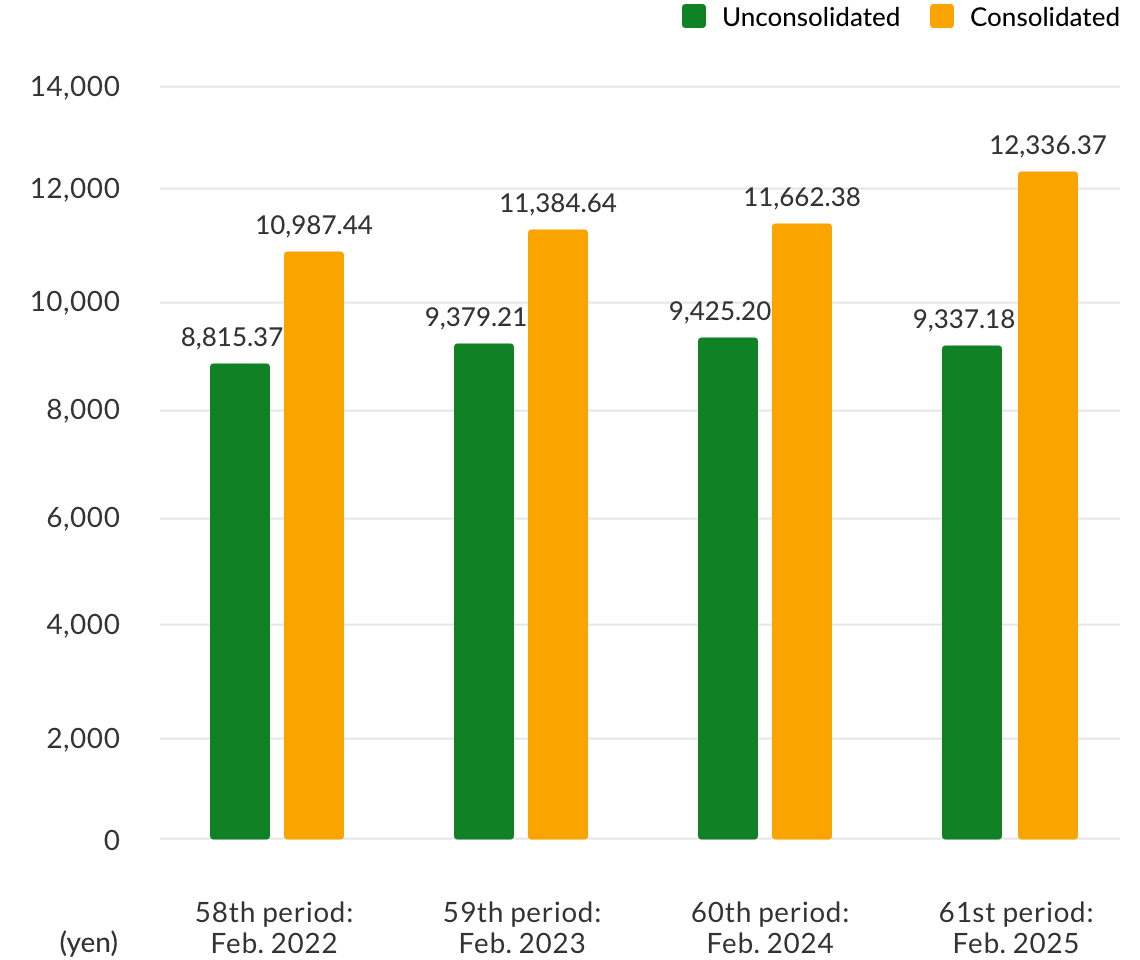
58th period
Feb. 202259th period
Feb. 202360th period
Feb. 202461st period
Feb. 2025Unconsolidated 8,815.37 9,379.21 9,425.20 9,337.18 Consolidated 10,987.44 11,384.64 11,662.38 12,336.37